Data Science Project: Battle of Neighborhood
Introduction
First of all we need to fetch the Data from the table in the following URL: “Postal Codes of Canada” Corresponding to the different postcodes of Toronto, for this purpose we will use BeautifulSoup library in Python. In addition, we will need to follow the next criteria:
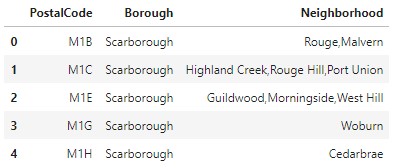
- The data frame will consist of three columns: PostalCode, Borough, and Neighborhood
- Only process the cells that have an assigned borough. Ignore cells with a borough that is Not assigned.
- than one neighborhood can exist in one postal code area. For example, in the table on the Wikipedia page, you will notice that M5A is listed twice and has two neighborhoods: Harbourfront and Regent Park. These two rows will be combined into one row with the neighborhoods separated with a comma as shown in row 11 in the above table.
- If a cell has a borough but a Not assigned neighborhood, then the neighborhood will be the same as the borough. So for the 9th cell in the table on the Wikipedia page, the value of the Borough and the Neighborhood columns will be Queen’s Park.
Preprocessing
For ignoring the cells without a Borough we will use the following code:
toronto_dropNotAssigned = toronto_df[toronto_df.Borough != 'Not assigned'].reset_index(drop=True)
for grouping the different neighborhoods and separe them with a comma I will use the following code:
toronto_grouped = toronto_dropNotAssigned.groupby(['PostalCode','Borough'], as_index=False).agg(lambda x: ','.join(x))
And Finally, to assign an empty neighborhood the next one:
mask = toronto_grouped['Neighborhood'] == "Not assigned"
toronto_grouped.loc[mask, 'Neighborhood'] = toronto_grouped.loc[mask, 'Borough']
looking like this right now:
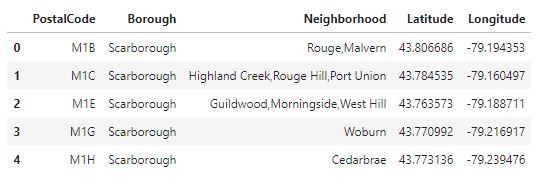
Once we have that table, I will append each latitude and longitude to the PostcalCode, for this purpose, I will use a simple inner join because I already have a .csv file from this page: “Latitude and Longitude” , the code for this will look like this:
#For SQL purpose I will make Postal Code as only one Word: PostalCode
coordenades.rename(index=str, columns={"Postal Code": "PostalCode"}, inplace = True)
neighborhood = pd.merge(toronto_grouped, coordenades, on='PostalCode', how='inner')
as a result, I will have a table that looks like this one:
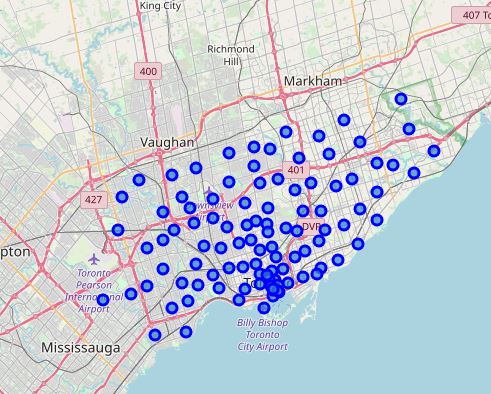
Once I have the table with each Postal code and latitude and longitude, I will plot the different points in a map using Folium library (Github does not allow to plot inline, so you will need to trust my screenshot because if you check the code on my Github profile you will not be able to see the map).
EXTRACTING INFORMATION
Now that I have the map with each of the postalcodes in it, using the FourSquare API (for more info go their main webpage: “Foursquare”) I will fetch all the shops, buildings surrounding those postcodes using the following code:
#Function to apply it to every Postcode we have.
def getNearbyVenues(names, latitudes, longitudes, radius=500):

    venues_list=[]
    for name, lat, lng in zip(names, latitudes, longitudes):
        print(name)

        # create the API request URL
        url = 'https://api.foursquare.com/v2/venues/explore?&client_id={}&client_secret={}&v={}&ll={},{}&radius={}&limit={}'.format(
            CLIENT_ID,
            CLIENT_SECRET,
            VERSION,
            lat,
            lng,
            radius,
            LIMIT)

        # make the GET request
        results = requests.get(url).json()["response"]['groups'][0]['items']

        # return only relevant information for each nearby venue
        venues_list.append([(
            name,
            lat,
            lng,
            v['venue']['name'],
            v['venue']['location']['lat'],
            v['venue']['location']['lng'],
            v['venue']['categories'][0]['name']) for v in results])

    nearby_venues = pd.DataFrame([item for venue_list in venues_list for item in venue_list])
    nearby_venues.columns = ['Neighborhood',
                  'Neighborhood Latitude',
                  'Neighborhood Longitude',
                  'Venue',
                  'Venue Latitude',
                  'Venue Longitude',
                  'Venue Category']

    return(nearby_venues)
Having as a result different things that surround those postcodes, for example things like parks, churchs and so on:
Once we have all the different buildings (exactly 2258) I will group them by their Neighborhood to make it more readable and more understandable, and once it is grouped, I will apply One Hot Encoding to extract the dummy variables of all of those buildings. I will do that to help me after to know what is the most frequency thing in each neighborhood. For this, I will use the following code:
toronto_onehot = pd.get_dummies(toronto_venues[['Venue Category']], prefix="", prefix_sep="")

# add neighborhood column back to dataframe
toronto_onehot['Neighborhood'] = toronto_venues['Neighborhood']

# move neighborhood column to the first column
fixed_columns = [toronto_onehot.columns[-1]] + list(toronto_onehot.columns[:-1])
toronto_onehot = toronto_onehot[fixed_columns]
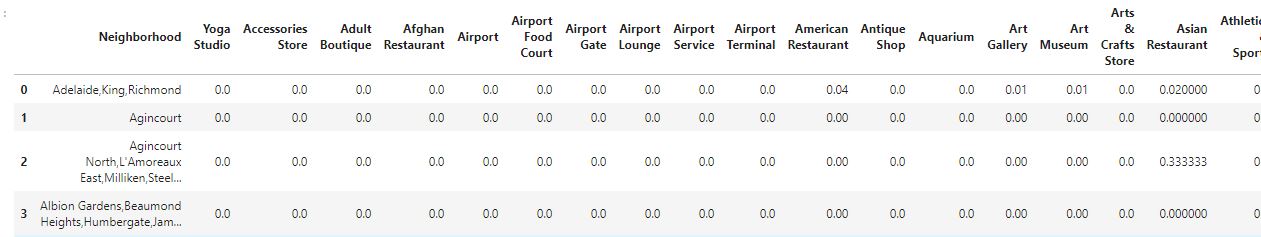
After, we will group them by neighborhood and apply the mean so I will be able to see the amount in each neighborhood, having as a result a table like this:
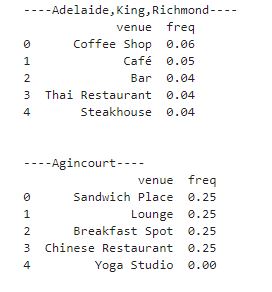
So now I am able to see what is more frequent in each neighborhood:
Now that I have the most frequency thing in each neighborhood and with the following code
def return_most_common_venues(row, num_top_venues):
    row_categories = row.iloc[1:]
    row_categories_sorted = row_categories.sort_values(ascending=False)

    return row_categories_sorted.index.values[0:num_top_venues]

#And add it into a pandas dataframe to be able to apply afterwards Kclustering.
num_top_venues = 10

indicators = ['st', 'nd', 'rd']

# create columns according to number of top venues
columns = ['Neighborhood']
for ind in np.arange(num_top_venues):
    try:
        columns.append('{}{} Most Common Venue'.format(ind+1, indicators[ind]))
    except:
        columns.append('{}th Most Common Venue'.format(ind+1))

# create a new dataframe
neighborhoods_venues_sorted = pd.DataFrame(columns=columns)
neighborhoods_venues_sorted['Neighborhood'] = toronto_grouped['Neighborhood']

for ind in np.arange(toronto_grouped.shape[0]):
    neighborhoods_venues_sorted.iloc[ind, 1:] = return_most_common_venues(toronto_grouped.iloc[ind, :], num_top_venues)

neighborhoods_venues_sorted.head()
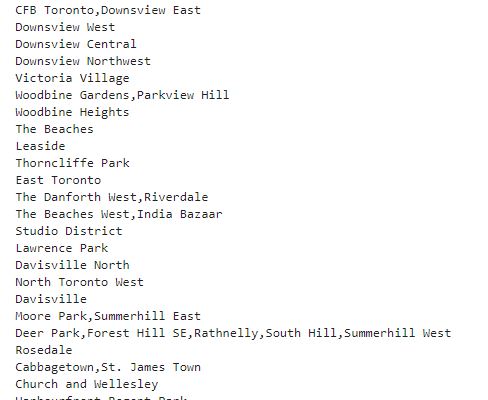
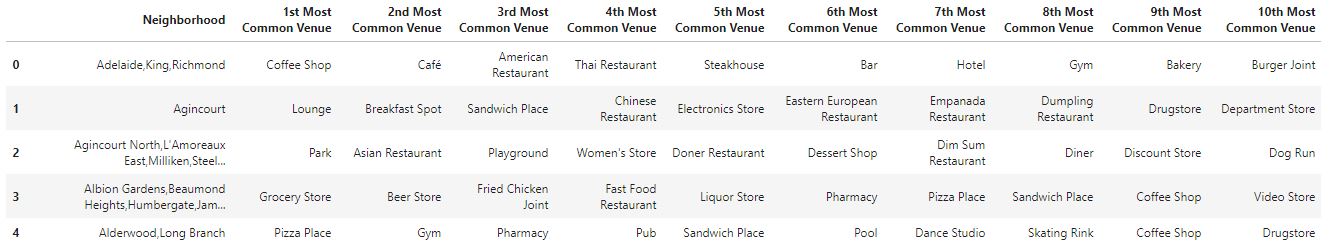
I will create the following table that it is easily understandable by everyone:
CLUSTERING
Now, I have to cluster the different neighborhoods to find some data like where should be the ideal place to build a new women shop, or where to build a new Mexican Restaurant for example. After testing, I found that the optimum amount of clusters should be 3, so I will fit the results in 3 different clusters and print them in the map. I will use the kMeans function available in sklearn.cluster for Python, and the code will look like this:
# set number of clusters, in this case we choose 3 clusters because if its >3 we will have clusters with only one data in it.
kclusters = 3

toronto_grouped_clustering = toronto_grouped.drop('Neighborhood', 1)

# run k-means clustering
kmeans = KMeans(n_clusters=kclusters, random_state=0).fit(toronto_grouped_clustering)
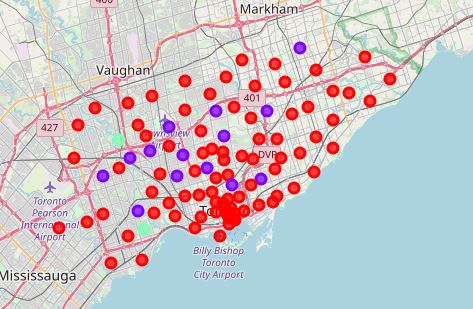
Once I have the different clusters I will classify them with different colors and display them in the previous map, there will be 3 colors. Red for cluster 0, Violet for cluster 1 and Blue for Cluster 2. With the following code I will display them:
# create map
map_clusters = folium.Map(location=[latitude, longitude], zoom_start=11)

# set color scheme for the clusters
x = np.arange(kclusters)
ys = [i + x + (i*x)**2 for i in range(kclusters)]
colors_array = cm.rainbow(np.linspace(0, 1, len(ys)))
rainbow = [colors.rgb2hex(i) for i in colors_array]

# add markers to the map
markers_colors = []
for lat, lon, poi, cluster in zip(toronto_merged['Latitude'], toronto_merged['Longitude'], toronto_merged['Neighborhood'], toronto_merged['Cluster Labels']):
    label = folium.Popup(str(poi) + ' Cluster ' + str(cluster), parse_html=True)
    folium.CircleMarker(
        [lat, lon],
        radius=5,
        popup=label,
        color=rainbow[cluster-1],
        fill=True,
        fill_color=rainbow[cluster-1],
        fill_opacity=0.7).add_to(map_clusters)

map_clusters
Having as a result:
Now checking the data of each cluster we can see what is the most common building for each cluster.
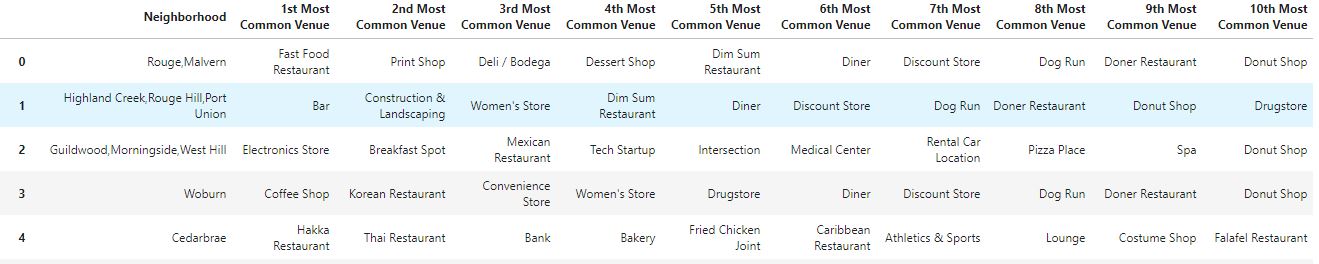
CLUSTER 0 (RED)
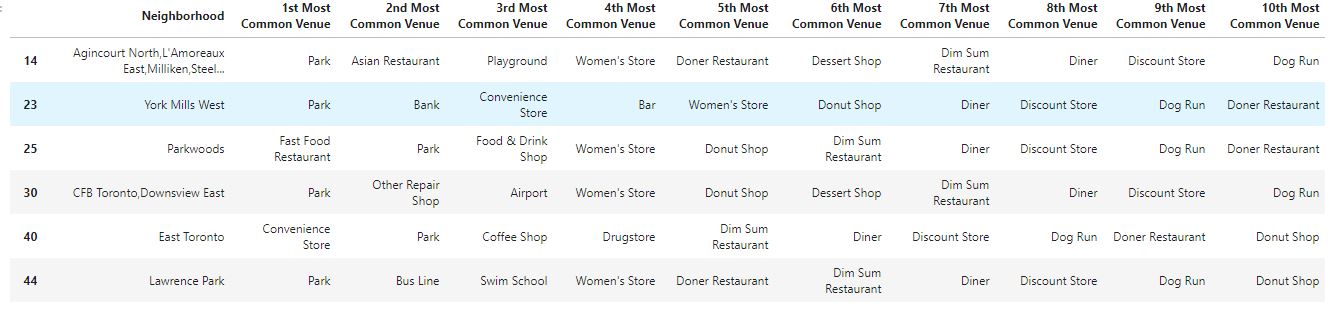
CLUSTER 1 (VIOLET)
CLUSTER 2 (BLUE)

So as we can see, the Cluster 0 is more the commercial area, where it is plenty of restaurants, and places to spend money. However, the Cluster 1 is mainly parks for chill and also some Women’s store and the Cluster 2 has the same data, that is really strange so maybe there is something wrong there, maybe you can tell me what, I am really looking forward to read your suggestions if you have any! :) So, if you would like to go to a Park, where should you go? For more info, visit the full project available in my github profile: